
Traffic Light Visualizations for Kibana
03 Apr 2017Kibana 5.3 shipped with an interesting feature that had been anticipated for quite a while. It provides the ability to display the latest value for a certain field using the Top Hit Aggregation. I'll show how to use the Top Hit Aggregation to create two different visualizations.
But first, of course you need some timestamped data. The following documents are minimal examples.
POST /logstash-2017.03.30/log
{
  "metric": 0.6,
  "ip": "192.168.0.1",
  "@timestamp": "2017-03-30T09:10:22.611Z"
}

POST /logstash-2017.03.30/log
{
  "metric": 0.4,
  "ip": "192.168.0.2",
  "@timestamp": "2017-03-30T09:10:22.611Z"
}

POST /logstash-2017.03.30/log
{
  "metric": 0.7,
  "ip": "192.168.0.1",
  "@timestamp": "2017-03-30T09:10:22.611Z"
}
Besides the timestamp there are two fields for each document: metric (which could be anything, e.g. used disk space, load or anything else) and ip (which is an identifier for a machine). There are two values for the ip 192.168.0.1 (0.6, 0.7) and one for 192.168.0.2 (0.4).
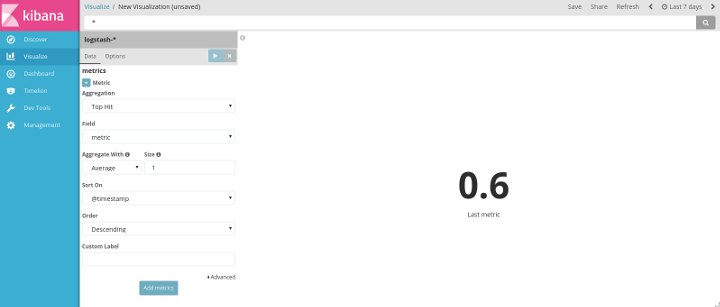
Metric Visualization
The easiest way to use the new aggregation type is by just displaying the latest value in a widget. You can create a new visualization using a metric, choosing Top Hit as aggregation. You can choose how many latest values you want to take into account (1 for only the latest) and how to aggregate them. By default the values will be sorted on timestamp in descending order which you can also change to display the first value.
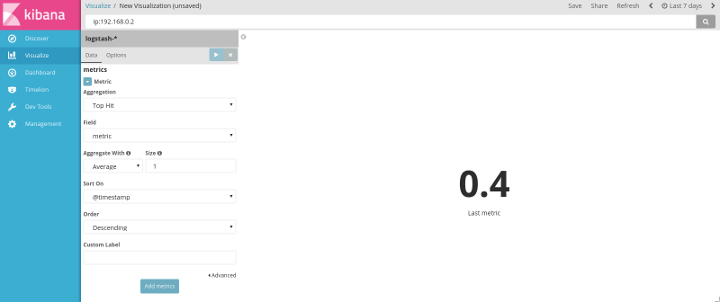
Of course you can also tie this visualization to a search, querying for the ip 192.168.0.2 will then only display the latest value for this certain ip.
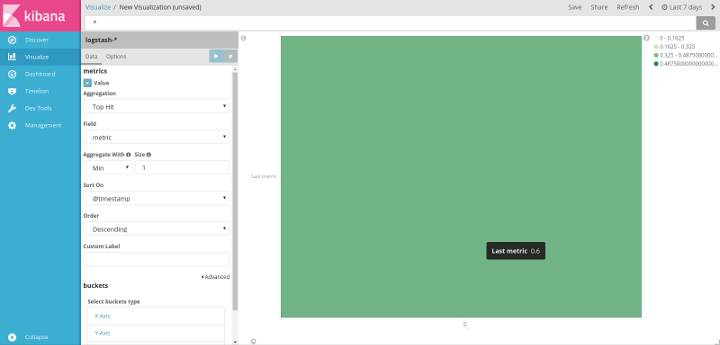
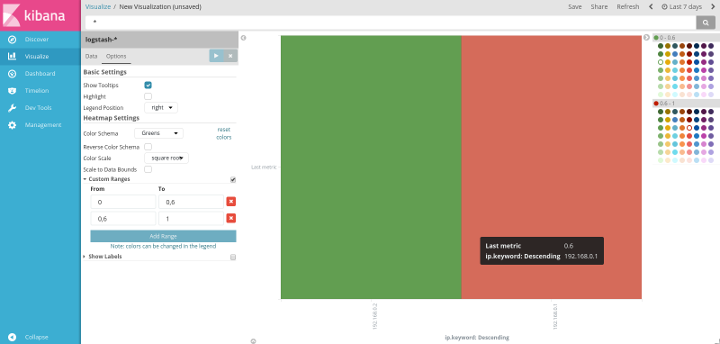
Heatmap Visualization
A more visual approach to displaying the latest value can be done using a heatmap. You can build a traffic light style dashboard of any values in your system.
The Top Hit can be registered as a metric aggregation in the first section of the heatmap configuration.
The buckets on the X-Axis can then be determined by a Terms aggregation on the ip field, displaying separate sections for each ip.
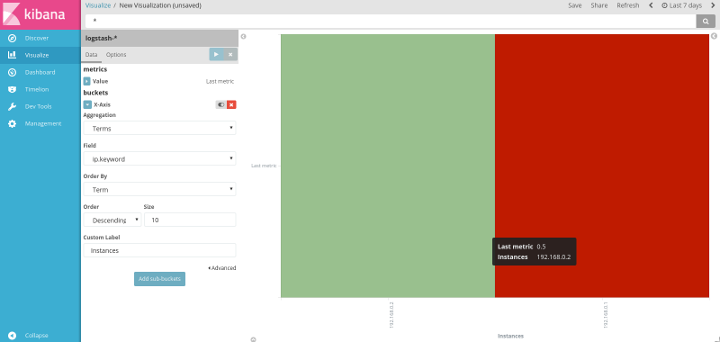
Finally, the color to display for the different values can be configured on the options tab. You can create custom ranges that can then be assigned to a certain color in the legend on the right.
These visualizations can help a lot to immediately judge the health of your system.