A Tour Through elasticsearch-kopf
13 Jun 2014When I needed a plugin to display the cluster state of Elasticsearch or needed some insight into the indices I normally reached for the classic plugin elasticsearch-head. As it is recommended a lot and seems to be the unofficial successor I recently took a more detailed look at elasticsearch-kopf. And I like it.
I am not sure about why elasticsearch-kopf came into existence but it seems to be a clone of elasticsearch-head (kopf means head in German so it is even the same name).
Installation
elasticsearch-kopf can be installed like most of the plugins, using the script in the Elasticsearch installation. This is the command that installs the version 1.1 which is suitable for the 1.1.x branch of Elasticsearch.
bin/plugin --install lmenezes/elasticsearch-kopf/1.1elasticsearch-kopf is then available on the url http://localhost:9200/_plugin/kopf/.
Cluster
On the front page you will see a similar diagram of what elasticsearch-head is providing. The overview of your cluster with all the shards and the distribution across the nodes. The page is being refreshed so you will see joining or leaving nodes immediately. You can adjust the refresh rate in the settings dropdown just next to the kopf logo (by the way, the header reflects the state of the cluster so it might change its color from green to yellow to red).
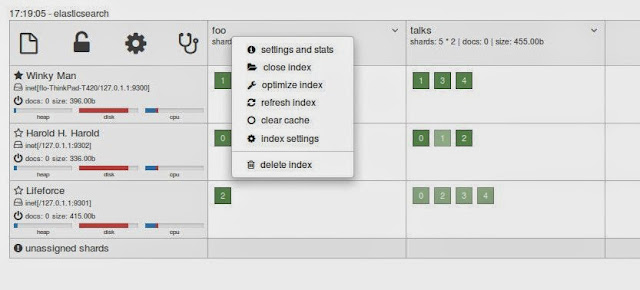
Also, there are lots of different settings that can be reached via this page. On top of the node list there are 4 icons for creating a new index, deactivating shard allocation, for the cluster settings and the cluster diagnosis options.
Creating a new index brings up a form for entering the index data. You can also load the settings from an existing index or just paste the settings json in the field on the right side.
The icon for disabling the shard allocation just toggles it, disabling the shard allocation can be useful during a cluster restart. Using the cluster settings you can reach a form where you can adjust lots of values regarding your cluster, the routing and recovery. The cluster health button finally lets you load different json documents containing more details on the cluster health, e.g. the nodes stats and the hot threads.
Using the little dropdown just next to the index name you can execute some operations on the index. You can view the settings, open and close the index, optimize and refresh the index, clear the caches, adjust the settings or delete the index.
When opening the form for the index settings you will be overwhelmed at first. I didn't know there are so many settings. What is really useful is that there is an info icon next to each field that will tell you what this field is about. A great opportunity to learn about some of the settings.
What I find really useful is that you can adjust the slow index log settings directly. The slow log can also be used to log any incoming queries so it is sometimes useful for diagnostic purposes.
Finally, back on the cluster page, you can get more detailed information on the nodes or shards when clicking on them. This will open a lightbox with more details.
REST
The rest menu entry on top brings you to another view which is similar to the one Sense provided. You can enter queries and let them be executed for you. There is a request history, you have highlighting and you can format the request document but unfortunately the interface is missing the autocompletion. Nevertheless I suppose this can be useful if you don't like to fiddle with curl.
Aliases
Using the aliases tab you can have a convenient form for managing your index aliases and all the relevant additional information. You can add filter queries for your alias or influence the index or search routing. On the right side you can see the existing aliases and remove them if not needed.
Analysis
The analysis tab will bring you to a feature that is also very popular for the Solr administration view. You can test the analyzers for different values and different fields. This is a very valuable tool while building a more complex search application.
Unfortunately the information you can get from Elasticsearch is not as detailed as the one you can get from Solr: It will only contain the end result so you can't really see which tokenizer or filter caused a certain change.
Percolator
On the percolator tab you can use a form to register new percolator queries and view existing ones. There doesn't seem to be a way to do the actual percolation but maybe this page can be useful for using the percolator extensively.
Warmers
The warmers tab can be used to register index warmer queries.
Repository
The final tab is for the snapshot and restore feature. You can create repositories and snapshots and restore them. Though I can imagine that most of the people are automating the snapshot creation this can be a very useful form.
Conclusion
I hope you could see in this post that elasticsearch-kopf can be really useful. It is very unlikely that you will ever need all of the forms but it is good to have them available. The cluster view and the rest interface can be very valuable for your daily work and I guess there will be new features coming in the future.


